WHS reports and statistics
Regional profiles of the work health and safety and worker's compensation data.
Locality profiles of the work health and safety and worker's compensation data.
- Brisbane work health and safety profile (PDF, 1.22 MB)
- Bundaberg work health and safety profile (PDF, 1.35 MB)
- Cairns region work health and safety profile (PDF, 1.05 MB)
- Central Queensland region work health and safety profile (PDF, 1.34 MB)
- Fraser Coast region work health and safety profile (PDF, 1.31 MB)
- Gladstone work health and safety profile (PDF, 1.18 MB)
- Gold Coast City work health and safety profile (PDF, 1.56 MB)
- Gympie work health and safety profile (PDF, 1.35 MB)
- Ipswich work health and safety profile (PDF, 2.14 MB)
- Logan work health and safety profile (PDF, 1.12 MB)
- Mackay work health and safety profile (PDF, 1.2 MB)
- Maranoa work health and safety profile (PDF, 2.76 MB)
- Moreton Bay work health and safety profile (PDF, 1.32 MB)
- Mt Isa work health and safety profile (PDF, 1.3 MB)
- Rockhampton work health and safety profile (PDF, 0.5 MB)
- South Burnett work health and safety profile (PDF, 5.44 MB)
- Southern Downs work health and safety profile (PDF, 1.85 MB)
- Sunshine Coast and Noosa work health and safety profile (PDF, 1.11 MB)
- Tablelands work health and safety profile (PDF, 1.56 MB)
- Toowoomba work health and safety profile (PDF, 0.46 MB)
- Townsville work health and safety profile (PDF, 0.9 MB)
- Whitsunday work health and safety profile (PDF, 1.11 MB)
- Wide Bay work health and safety profile (PDF, 1.32 MB)
WHSQ reports monthly to Safe Work Australia about notified fatalities that occurred at a workplace or resulted from a work activity.
- July-December 2023 (PDF, 0.36 MB)
- January-June 2023 (PDF, 0.37 MB)
- July-December 2022 (PDF, 0.37 MB)
- January–June 2022 (PDF, 0.37 MB)
- July-December 2021 (PDF, 0.38 MB)
- January–June 2021 (PDF, 0.38 MB)
- July–December 2020 (PDF, 0.34 MB)
- January–June 2020 (PDF, 0.38 MB)
- July–December 2019 (PDF, 0.42 MB)
- January–June 2019 (PDF, 0.41 MB)
- July–December 2018 (PDF, 0.42 MB)
- January–June 2018 (PDF, 0.4 MB)
- July–December 2017 (PDF, 0.33 MB)
- January–June 2017 (PDF, 0.35 MB)
- July–December 2016 (PDF, 0.38 MB)
- January–June 2016 (PDF, 0.38 MB)
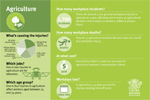
Agriculture industry infographic postcard (PDF, 0.31 MB)
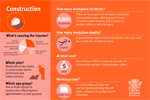
Construction industry infographic postcard (PDF, 0.28 MB)
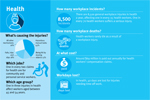
Health industry infographic postcard (PDF, 0.28 MB)
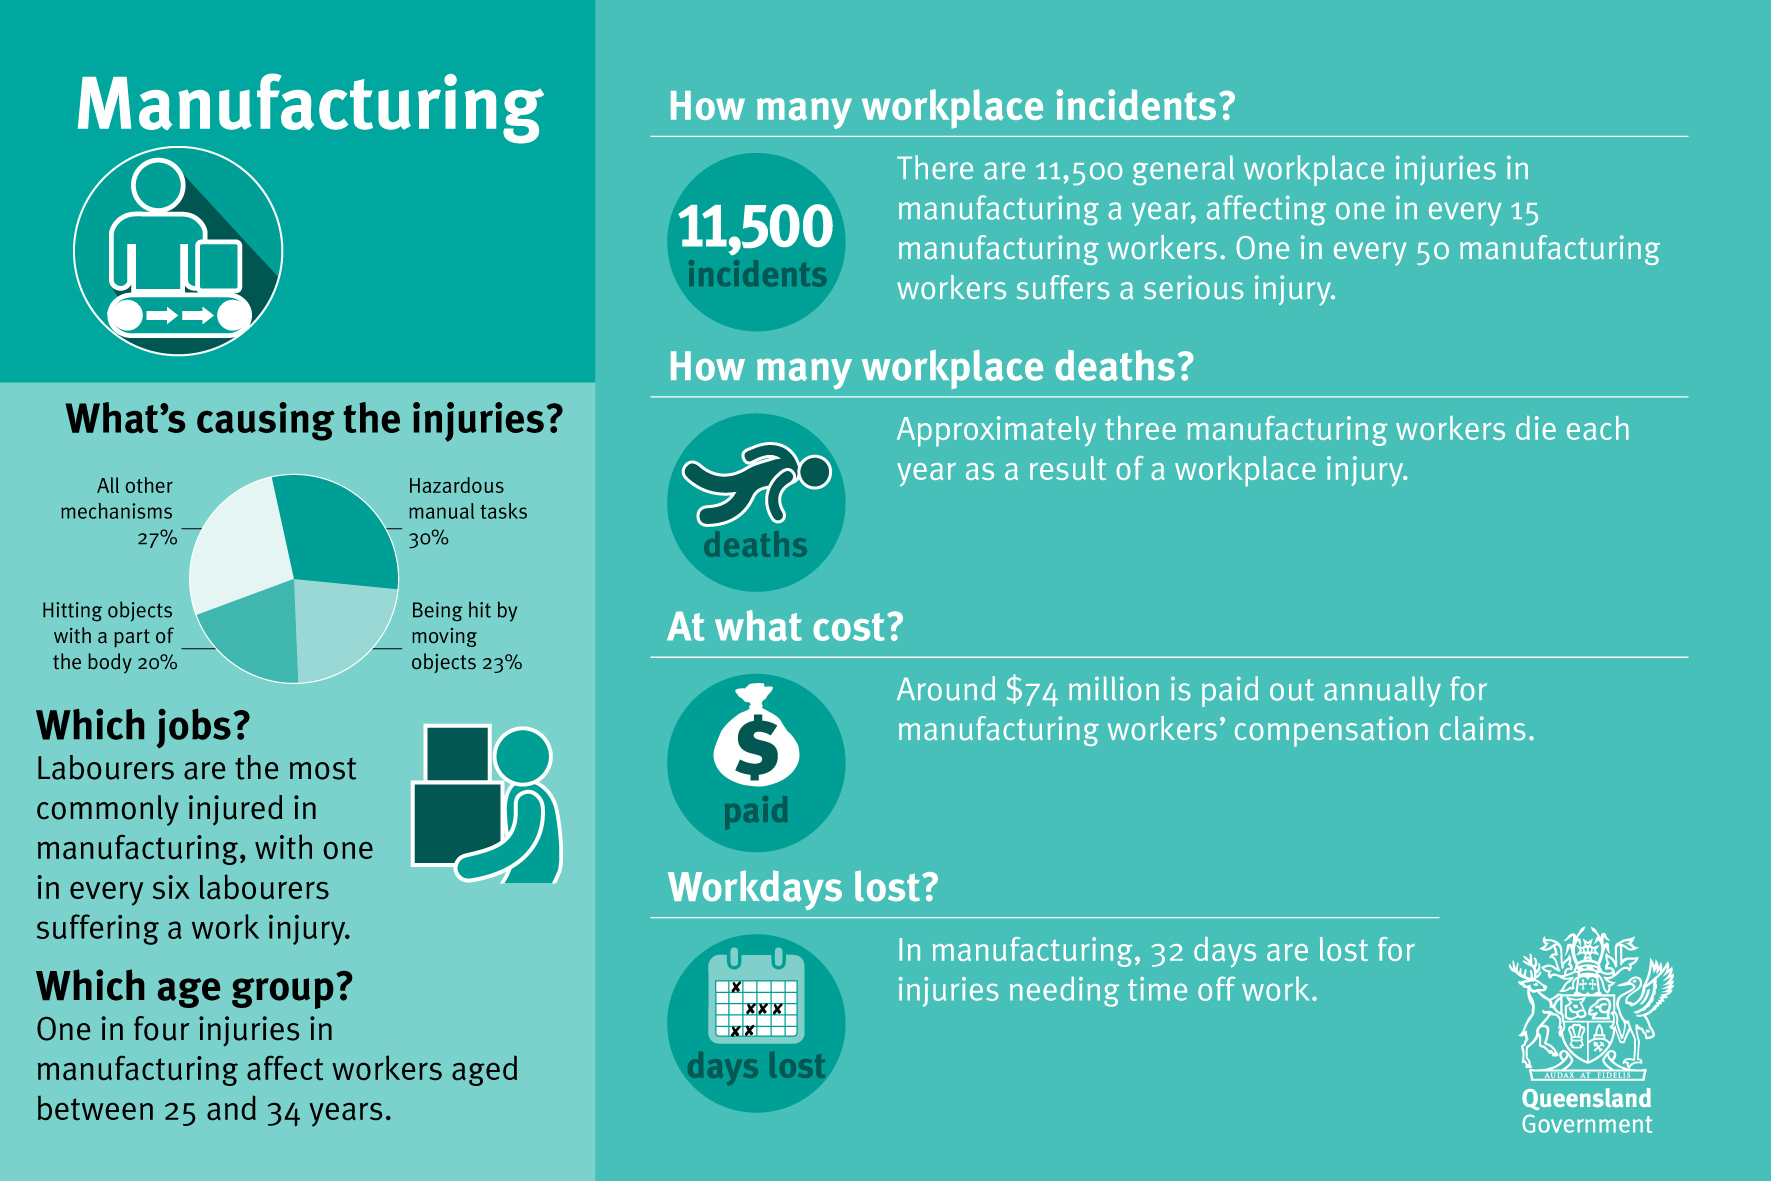
Manufacturing industry infographic postcard (PDF, 0.29 MB)
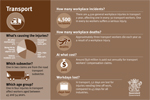
Transport industry infographic postcard (PDF, 0.32 MB)
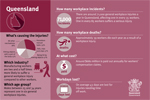
Queensland infographic postcard (PDF, 0.27 MB)
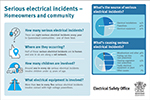
Serious electrical incidents – Homeowners and community (PDF, 0.33 MB)
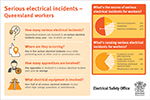
Serious electrical incidents – Queensland workers (PDF, 0.33 MB)
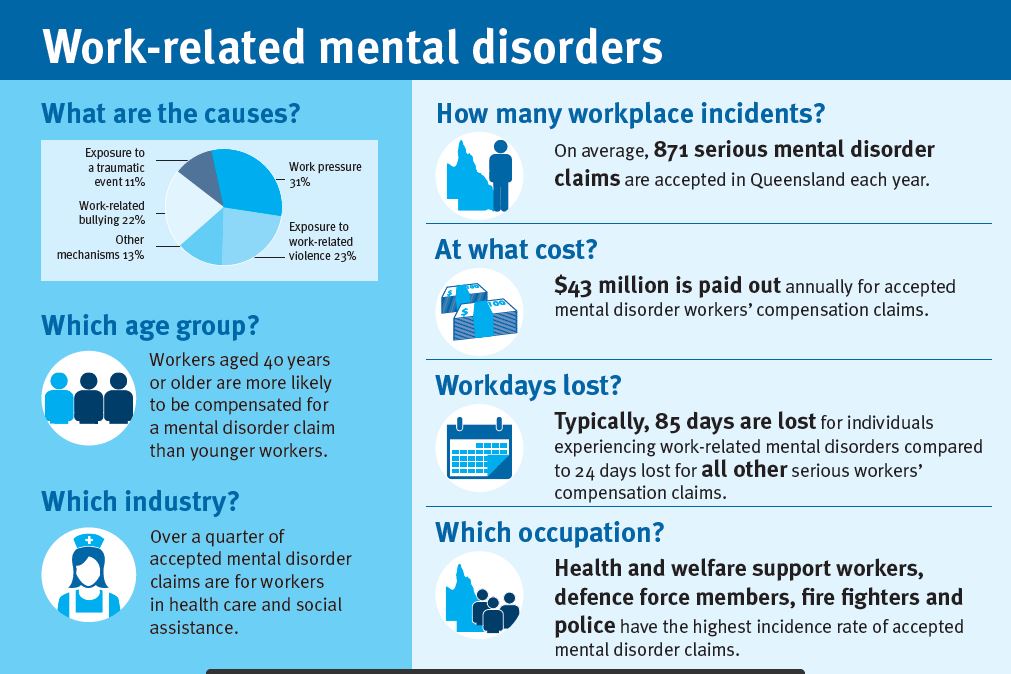
Work-related mental health disorders infographic postcard (PDF, 0.22 MB)
- Queensland: Statistical update 2015–16 to 2019–20 (PDF, 1.06 MB)
Agriculture, forestry and fishing
Construction
- Construction: Statistical update 2015–16 to 2019–20 (PDF, 0.77 MB)
Health and community services
Manufacturing
- Manufacturing: Statistical update 2015–16 to 2019–20 (PDF, 1.02 MB)
Retail and wholesale
- Retail and wholesale - Statistical update 2015-16 to 2019-20 (PDF, 1.09 MB)