WorkCover Connect how-to guide
WorkCover Connect how-to guide for analytics dashboards
This section outlines how to use some of the new analytics features in WorkCover Connect including the claims and safety dashboards.
- Create and save a claims data download report templates
- Save and share a dashboard
- Export a PDF or CSV file from a dashboard
- Compare data by policies / WICs & custom fields
- Change between injury cost and injury count
- Customise colours of charts
- Change the time period from 5 years to last 12 months
- View data by accident date or registered date
- Turn charts on and off in your dashboard
- Exclude journey claims from your claims dashboard
- Exclude journey injuries and non-accepted claims from your safety dashboard
- How do we report on apprentices? Use custom fields to include your 'occupation' data against your claims.
How to setup, save and share claims data download templates

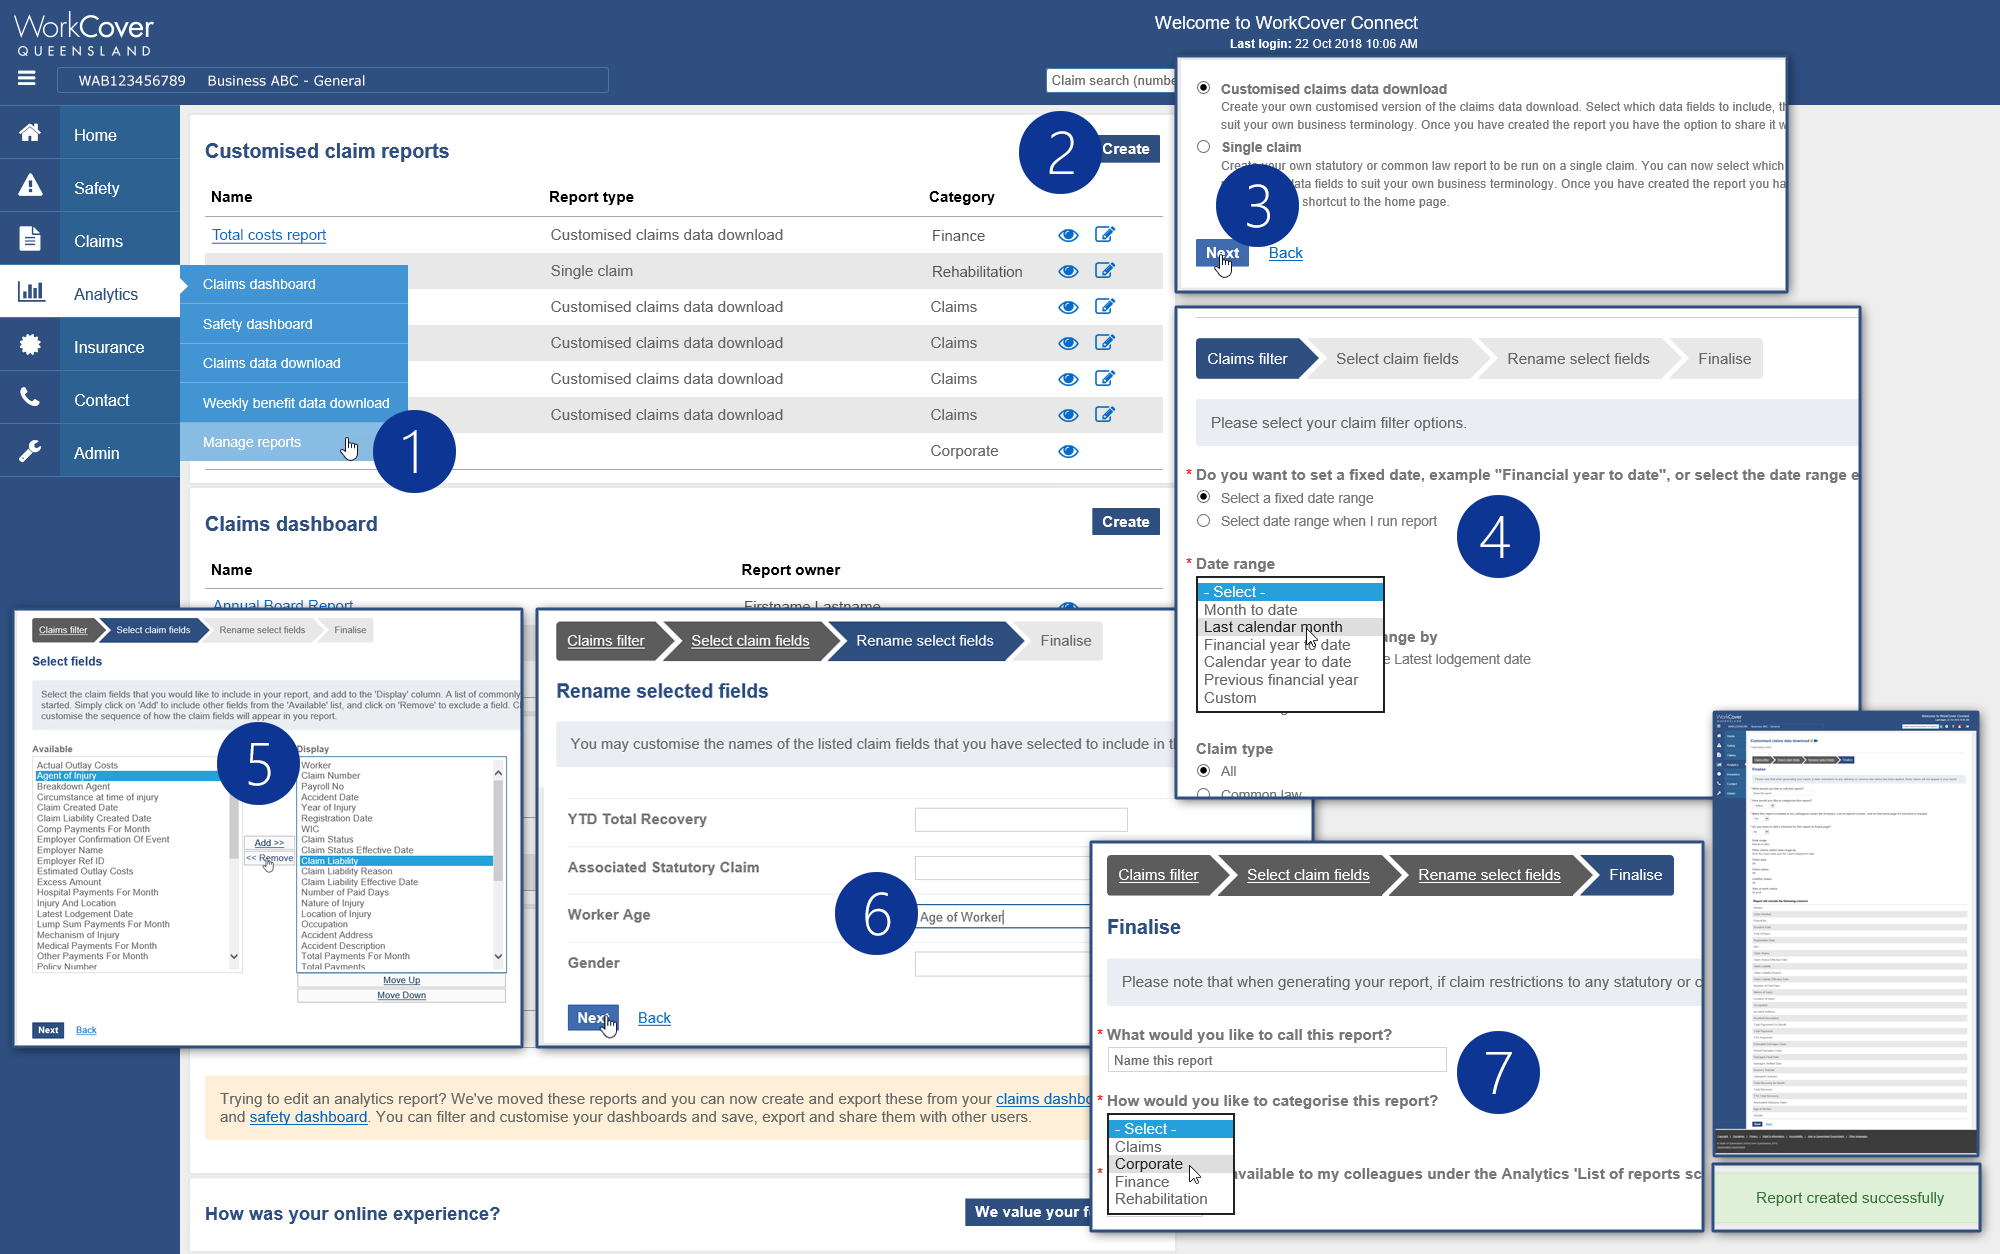
- Navigate to the 'manage reports' section from the analytics menu in WorkCover Connect.
- The 'Customised claim reports' section offers a single claim snapshot template or a customised claims data download for a raw CSV export. Press the 'create' button to get started.
- Select 'customised claims data download' and press the next button.
- In the claims filter step, you can set report parametres such as date range, report type and stay at work status.
- On the next screen you can select available claim fields to include or exclude in your report template.
- The data in WorkCover fields may be labelled differently to your data. In this step you can relabel those fields so they will match when you reimport the data into your own systems.
- In the final step, name your report template so you can clearly identify it when you next need the same data. You can also add it to the claims, corporate, finance or rehabilitation category or select whether to share this report with other account holders within your policy. Review the details on the page, including the preview of fields you selected in the previous steps, and press the save button at the bottom of the page when you're done.
Save and share a dashboard
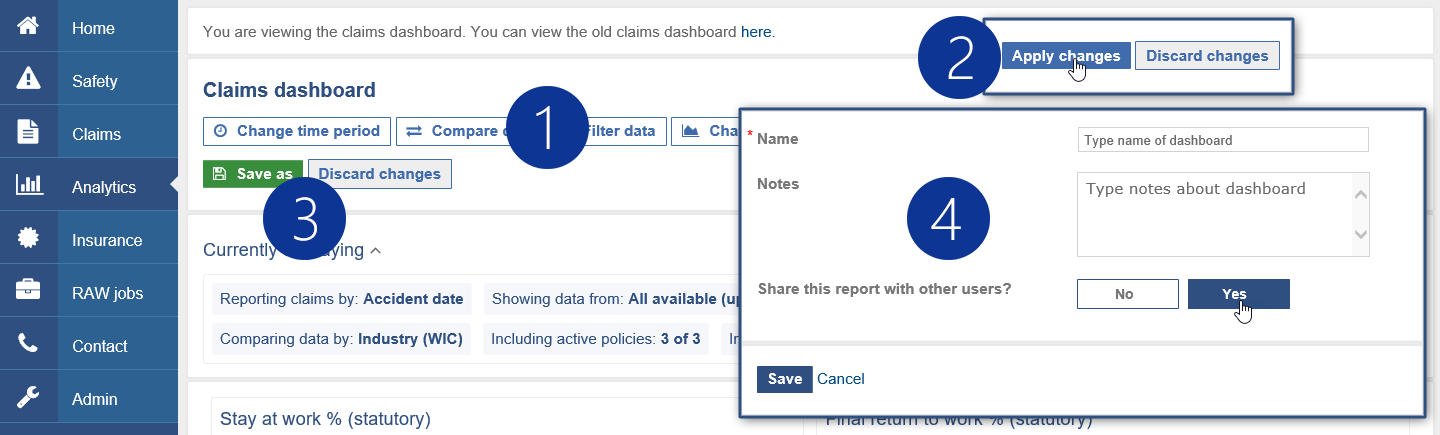
- Select an option to customise your dashboard. You will be taken to the settings page for that feature.
- On the settings page, after changing settings, click 'apply changes'. This will return you to the dashboard with the new settings.
- A 'save as' and 'discard changes' button appear on the dashboard. Press 'save as' to load the save and share screen.
- Name the dashboard and include notes if required. Select 'yes' if you'd like to share the report with other accounts in your organisation
Export a PDF or CSV file from a dashboard
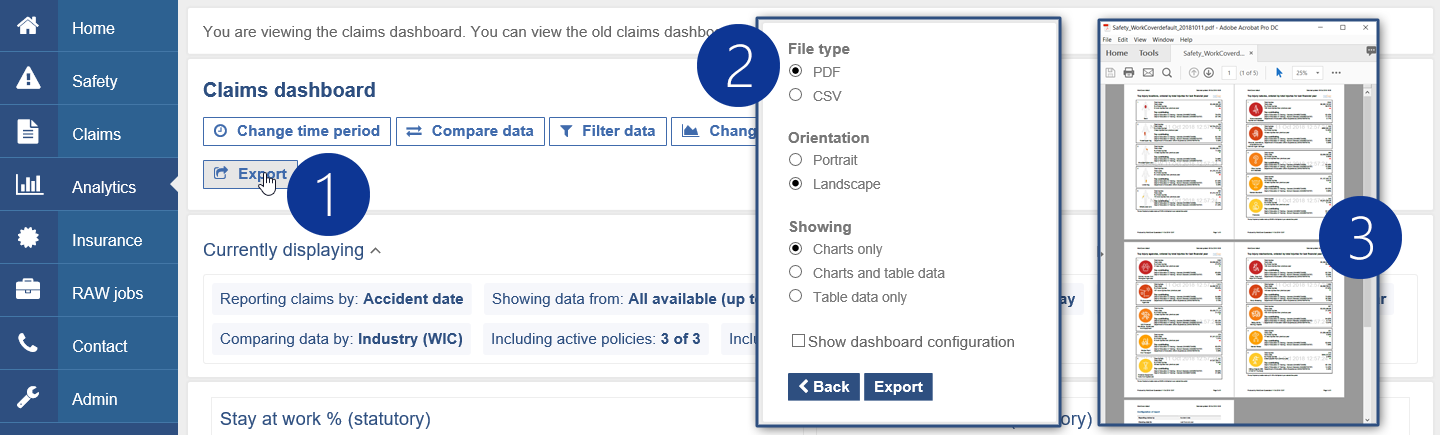
- Customise dashboard settings, then press the 'export' button.
- This loads export options such as format (CSV, PDF), orientation and which elements to show in the download. Press the export button.
- A PDF or CSV document is then opened or saved to your computer.
Compare data by policies / WICs & custom fields

- Navigate to the claims dashboard
- Press the 'compare data' button
- Select comparison options from the drop down list including policy, industry (WIC) or custom field
Change between injury cost and injury count
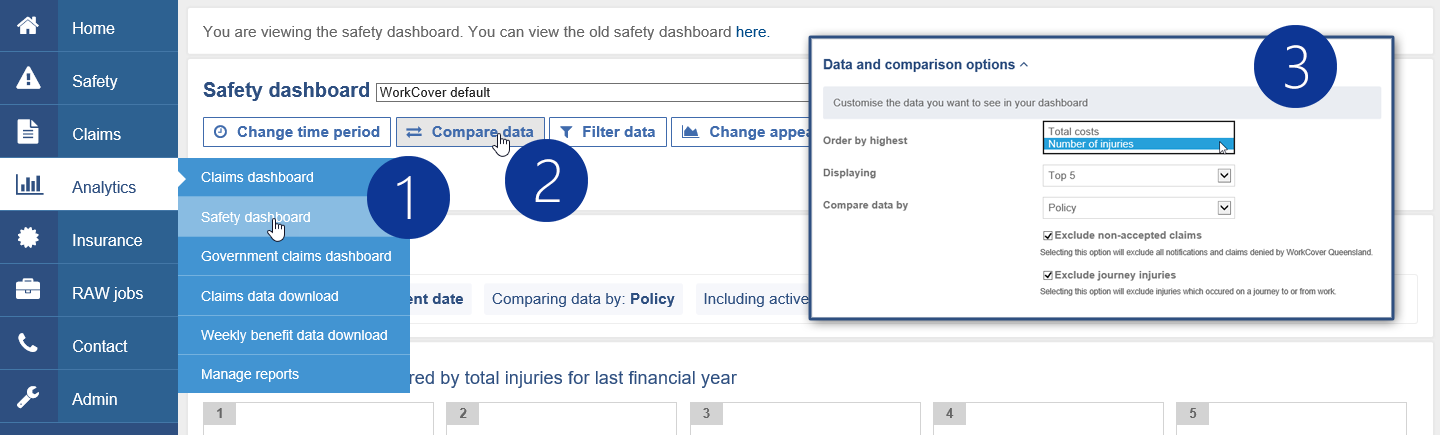
- Navigate to the safety dashboard
- Press the 'compare data' button
- Select comparison options from the drop down list including injury count versus industry cost or policy, industry (WIC) and custom field. You can also choose to display the top 5 or all.
Customise colours of charts

- Navigate to the claims or safety dashboard
- Press the 'change appearance' button
- The customise display section appears, showing colour options for each chart or graph. Set the colours for your organisation.
Change the time period from 5 years to last 12 months
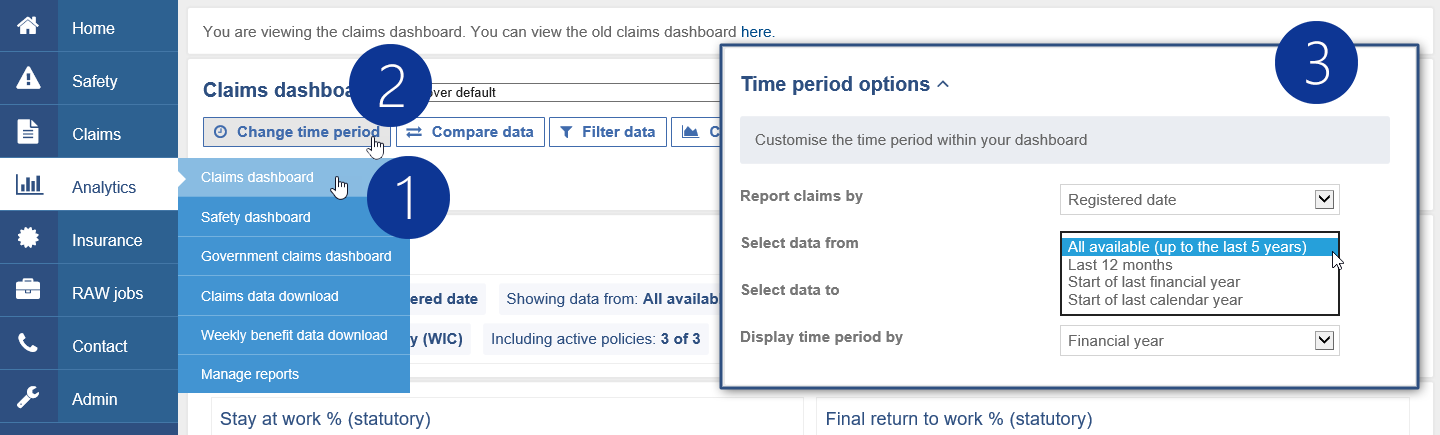
- Navigate to the claims dashboard
- Press the 'change time period' button
- The time period section offers the option to see claims by registered or accident date, the from and to dates and the time period
View data by accident date or registered date
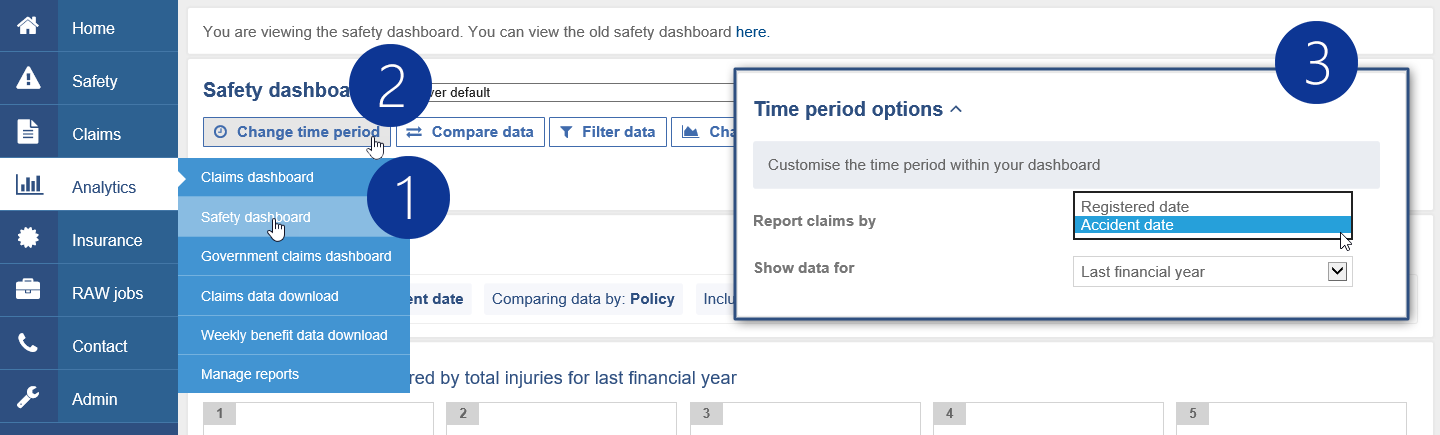
- Navigate to the safety dashboard
- Press the 'change time period' button
- The time period section offers the option to browse claims by accident or registered date, and the time period
Turn charts on and off in your dashboard

- Navigate to the claims or safety dashboards
- Press the 'change appearance' button
- The tickbox controls chart display. All charts are on by default. Untick to turn a chart off.
Exclude journey claims - claims dashboard
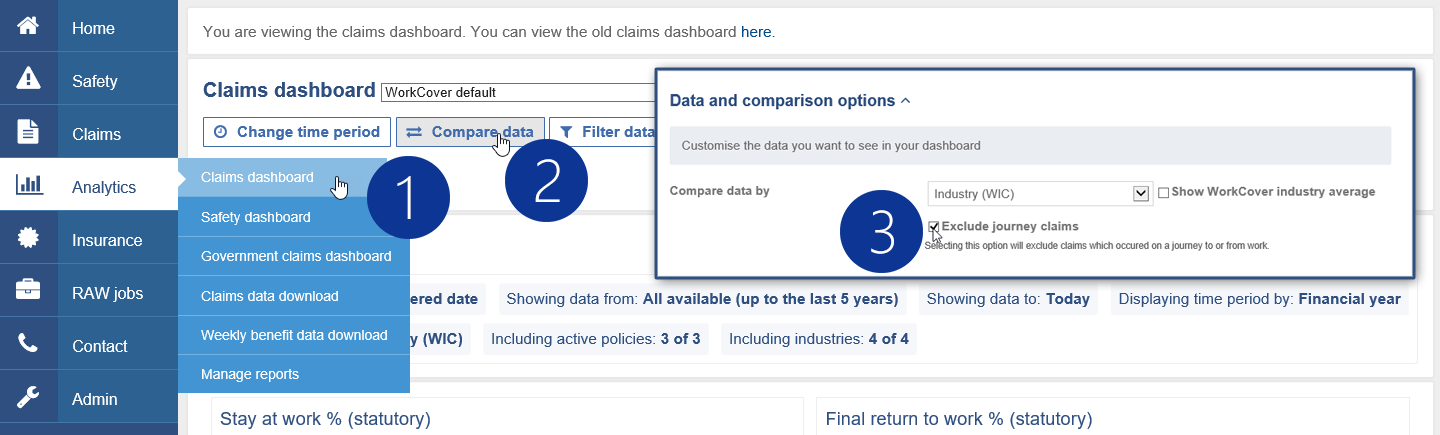
- Navigate to the claims dashboard
- Press the 'compare data' button
- Tick the 'exclude journey claims' box under the drop down menu
Exclude journey injuries and non-accepted claims - safety dashboard
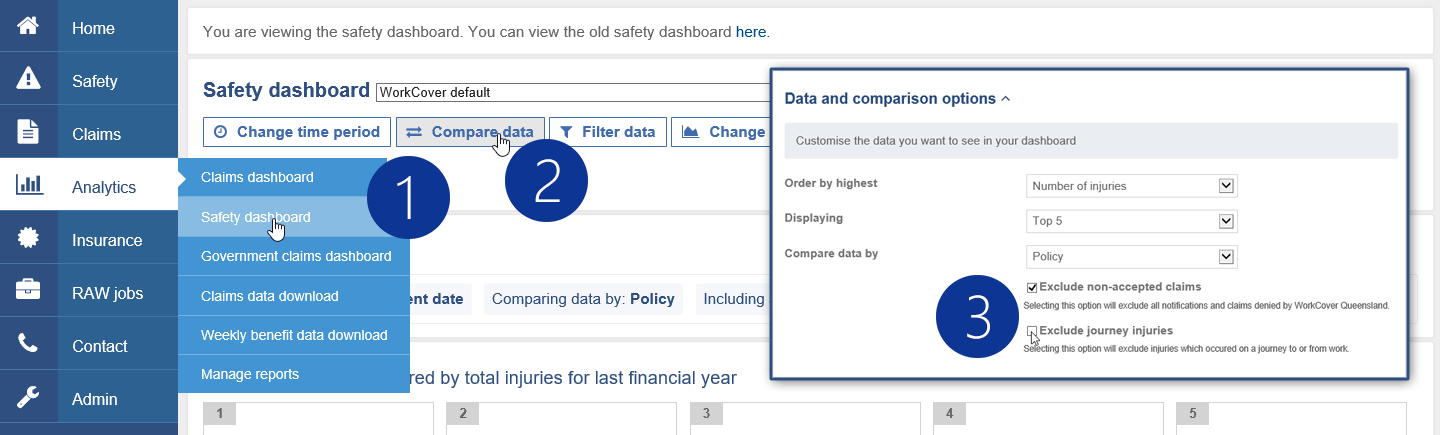
- Navigate to the safety dashboard
- Press the 'compare data' button
- Tick 'exclude non-accepted claims' or 'exclude journey claims' to exclude those options
How do we report on apprentices? Use custom fields to include your 'occupation' data against your claims.
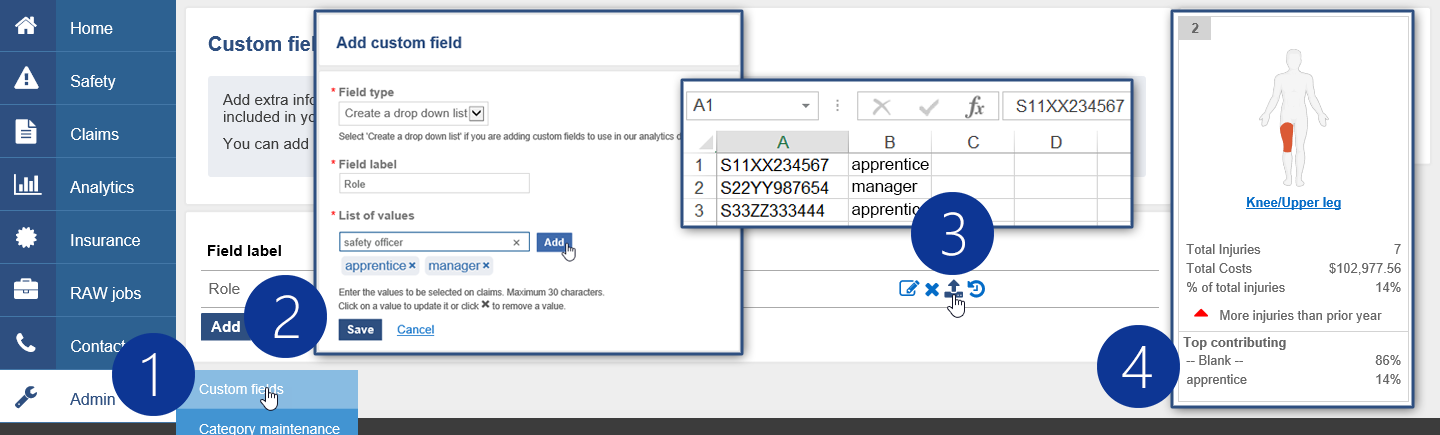
- Navigate to the custom fields page via the admin menu in WorkCover Connect
- Add a custom field with the label 'role' or 'occupation'. Select 'create a drop down list' from the field type menu. In the 'values' field, list roles which the organisation collects data for such as 'apprentice' or 'safety manager'.
- Upload the spreadsheet with the role values against the related claim number
- Select the 'compare' option within either the safety or claims dashboard to browse the custom field data
Do you have a question that's not answered here?
Please contact your relationship manager who can work with you to customise your dashboards to get the most power for your business.